4 Marketing Measurement Quick Wins: Report Results That Leadership Actually Cares About
4 Marketing Measurement Quick Wins: Report Results That Leadership Actually Cares About
Strategic Analysis by: Insight2Strategy
Published: May 25, 2026
Executive Reading Time: 8 minutes
Executive Strategic Insights
- The gap isn't measurement — it's communication. 83% of CEOs believe marketing drives growth, yet only 30% of CMOs report a clearly defined view of marketing ROI inside their organizations. (McKinsey)
- Four structural changes close the gap this week — none require new software, new budget, or additional team capacity.
- Replace multi-page dashboards with a 1-page executive scorecard organized around pipeline contribution, campaign efficiency, and trend indicators.
- Translate every metric with a single "What This Means" sentence that bridges numbers to business outcomes — removing the interpretive burden from leadership.
- Pre-defined traffic-light thresholds shift leadership meetings from reactive Q&A to strategic decision-making about red metrics only.
- The "What We're Doing Next" section is the highest-leverage change. It shifts the leadership conversation from "prove your worth" to "do these next steps make sense?" — repositioning marketing as a strategic function, not a reporting one.
Following along? Get the free Marketing Measurement Toolkit — ready-built templates for every framework in this article.
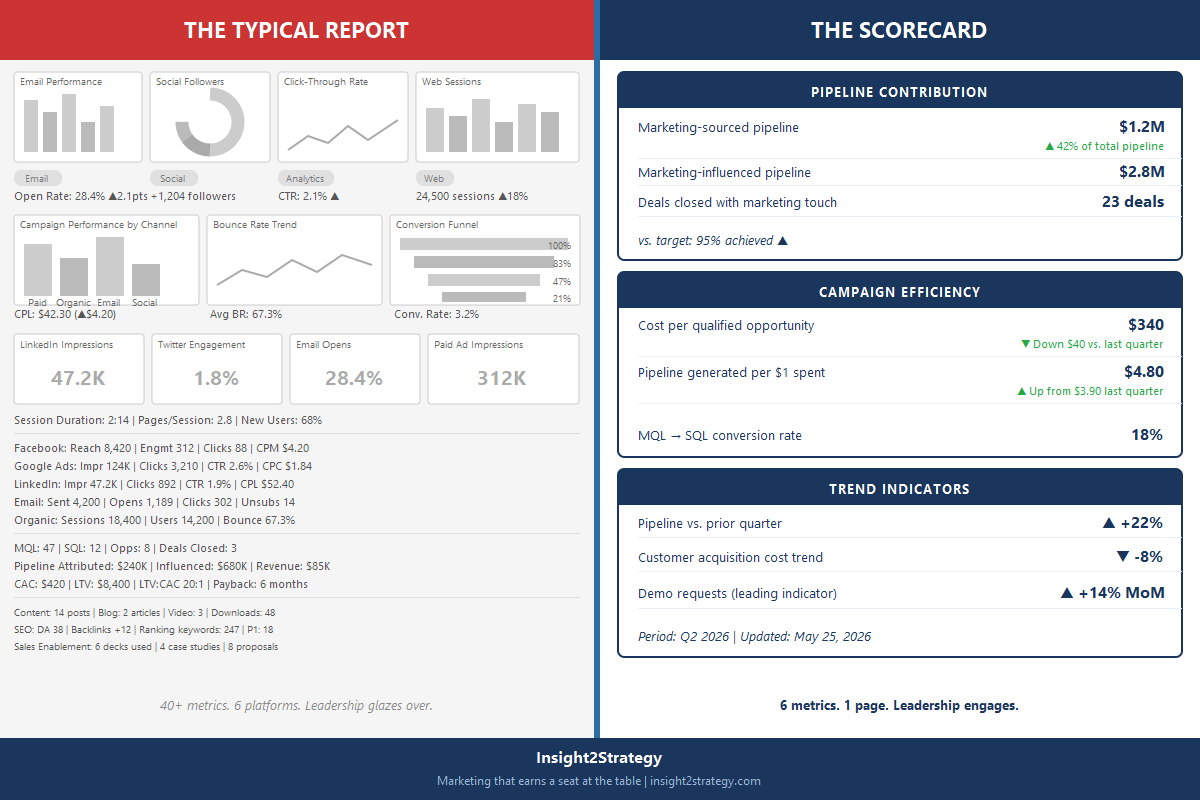
The typical marketing report shows everything.
Charts. Impressions. Click-through rates. Email opens. Social followers. Campaign dashboards that require three scrolls just to reach the bottom.
Leadership glazes over.
Then someone asks: "How many deals did marketing contribute to this quarter?"
And there's an uncomfortable pause.
Here's what that pause is actually telling you: you don't have a measurement problem. You have a communication problem disguised as one. The data your team tracks is probably fine. What's broken is the translation — between what your team measures and what the leadership team needs to make decisions.
The disconnect runs deep. Research shows that 83% of global CEOs believe marketing can be a major driver of growth (McKinsey & Company) — yet fewer than a third of marketing leaders can clearly demonstrate that impact in a way executives find credible. Only 30% of CMOs believe there's a clearly defined view of marketing ROI inside their organizations (McKinsey).
The gap isn't effort. It's structure.
Below are four quick wins you can implement this week to transform marketing reporting from a data dump into a strategic briefing that leadership actually engages with.
Quick Win 1: Replace Your Marketing Dashboard With a 1-Page Executive Scorecard
The Problem
Multi-page dashboards are designed for implementation teams. They show thousands of data points across a dozen channels — which produces cognitive overload for executives who don't have the context to interpret them. When everything is visible, nothing is important. Leadership doesn't have time to sift through platform exports; they need a single snapshot that tells them whether marketing is working.
The Solution
Replace the dashboard with a 1-page executive marketing scorecard structured around the three dimensions leadership already uses to evaluate every function in the company:
1. Pipeline Contribution (The What)
- Marketing-sourced pipeline this period (value + % of total pipeline)
- Marketing-influenced pipeline (touched at least one marketing asset before close)
- Deals closed with marketing involvement
2. Campaign Efficiency (The How Well)
- Cost per qualified opportunity by channel
- Pipeline generated per dollar of marketing spend
- Conversion rate: marketing qualified leads → sales qualified leads
3. Trend Indicators (The Where We're Heading)
- Pipeline trend vs. prior period (directional arrow + percentage)
- Customer acquisition cost trend
- One forward signal (e.g., "demo requests up 14% month-over-month")
Implementation
Open Google Slides, Looker Studio, Power BI, or a simple spreadsheet. Add only these three sections. Limit yourself to 6–8 headline metrics total. Each metric gets: current value, target, variance, and a one-word trend label (Up / Flat / Down).
The constraint is the point. If a metric doesn't fit on one page, it belongs in a supporting appendix — not the executive summary.
⚡ Quick Implementation Tip
Open a blank slide or spreadsheet right now and draw three boxes: Pipeline Contribution, Campaign Efficiency, Trend Indicators. Drop your best available metric into each. You've started your scorecard. Add the remaining metrics this week. The structure matters more than having every number on day one.
Business Impact
Research from Gartner's CMO studies shows that marketing leaders using aligned, cross-functional dashboards are 2.4x more likely to hit their revenue targets. The 1-page scorecard doesn't just improve reporting — it repositions marketing from a cost center reporting activity to a growth function reporting outcomes.
Quick Win 2: Add a "What This Means" Sentence to Every Metric
The Problem
Raw numbers force executives to interpret data without the context to do so accurately.
When your report shows "Website traffic: 24,500 (+18%)," leadership is left asking: Is 18% good? Did it help us sell anything? Should we invest more here? The absence of interpretation creates space for skepticism — and in budget conversations, skepticism always cuts against marketing.
Research indicates that fewer than two-thirds of marketers include financial outcomes when presenting results to leadership (Grow.com), contributing to persistent executive skepticism about marketing's contribution to revenue.
How to Report Marketing Results to Executives: The Solution
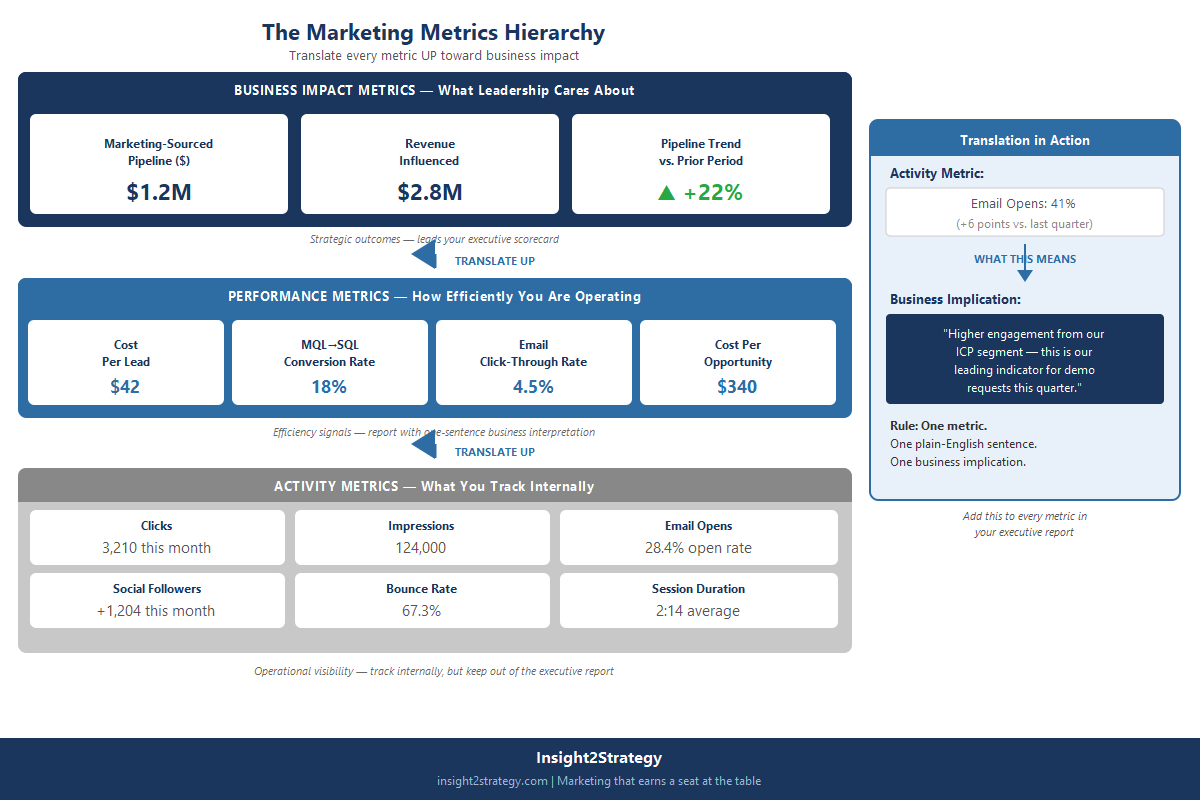
For every metric you report, add one sentence: "What this means for the business."
Not a paragraph of justification. One crisp sentence that bridges the number to a business outcome.
Examples:
Website traffic increased 18%.
What this means: "Qualified organic traffic from our target industries is growing — this is the leading indicator for demo requests over the next 6–8 weeks."
Cost per lead increased 22%.
What this means: "We shifted budget toward higher-intent search campaigns that convert to opportunities at 3x the rate of our previous channel mix. The higher CPL reflects a deliberate trade-off, not inefficiency."
MQLs decreased 5% month-over-month.
What this means: "Volume declined slightly, but average lead quality improved — SQL conversion is up 15%, reducing the average sales cycle by 3 days. The mix shift is intentional."
Implementation
Build an internal "translation template" — a simple document mapping each metric you track to its business implication. The first time takes 30 minutes. After that, updating it monthly takes 5–10 minutes because the context doesn't change, only the numbers.
Business Impact
Interpretation changes the dynamic. When you explain that a cost increase reflects a strategic shift rather than inefficiency, you're not defending — you're leading. Organizations that consistently translate metrics into business language stop being asked "is marketing working?" and start being asked "what should we invest in next?"
📥 Get the Complete Marketing Measurement Toolkit
Ready-built templates for everything in this article — scorecard, threshold guide, attribution template, reporting calendar, and more. Free download.
Quick Win 3: Build a "Traffic Light" Status System for Your Marketing Metrics
The Problem
Performance changes without thresholds are noise.
A 10% pipeline decline might be within normal monthly variance, or it might signal that a major campaign is failing. Without pre-defined benchmarks, every number requires an explanation marketing wasn't ready to give — and leadership meetings become reactive Q&A sessions instead of strategic conversations.
The Solution
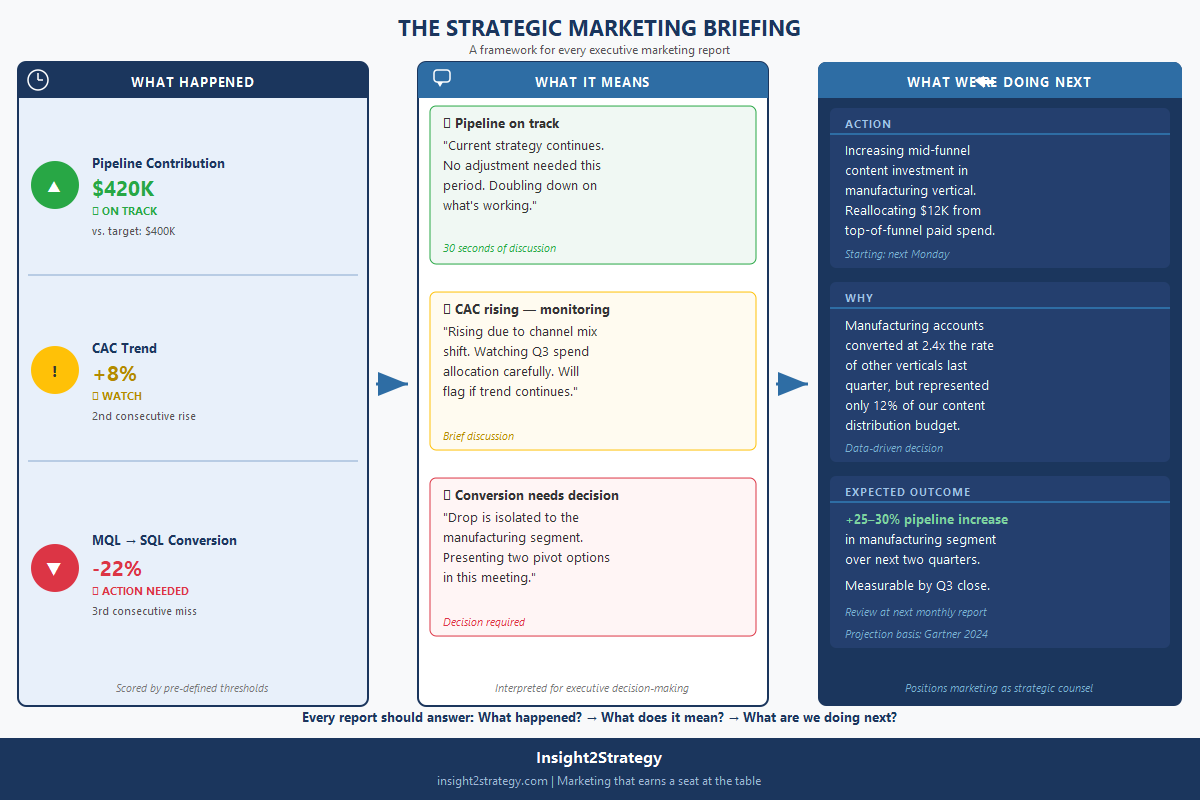
Define performance thresholds before reporting begins, and color-code every key metric in every report:
- Green (On Track): Metric is within 5% of target, or showing planned growth
- Yellow (Watch): Metric is 6–20% below target, or trending negatively for two consecutive periods
- Red (Needs Action): Metric is more than 20% below target, or has missed target for three consecutive months
Implementation
Sit with leadership for 30 minutes — once — and agree on thresholds for your top 5–7 metrics. Document them in a one-page "Reporting Standards" reference. Apply conditional formatting in your reporting tool or use simple colored dots in slides.
Example thresholds:
| Metric | 🟢 Green | 🟡 Yellow | 🔴 Red |
|---|---|---|---|
| Marketing-sourced pipeline | ≥ target | 80–99% of target | < 80% of target |
| Cost per opportunity | ≤ $X | $X–$X+20% | > $X+20% |
| Conversion rate (MQL→SQL) | ≥ benchmark | 10% below benchmark | 20%+ below benchmark |
Once thresholds are documented and agreed, leadership interprets color codes without needing to ask what's normal. The research supports this approach: visual data representations, when simplified and pre-contextualized, significantly improve the speed and accuracy of strategic decisions made by senior leaders (Harvard Business Review).
Business Impact
Traffic light reporting restructures meetings around decisions, not status updates. Green metrics get 30 seconds. Yellow metrics get brief discussion. Red metrics get decisions. Leadership time is spent where it creates value — not on data that was already working.
Quick Win 4: End Every Report With "What We're Doing Next — and Why"
The Problem
Most marketing reports are backward-looking. They explain what happened last month. But executives are almost exclusively interested in the future: where should we invest, what's not working, and what are we doing about it?
When reports stop at the data, they position marketing as historians. And historians don't get asked their opinion on the next strategic move.
How to Make Marketing Reports More Forward-Looking: The Solution
Add a final section to every report — no longer than half a page — structured around three elements:
- Action: What you're starting, stopping, or shifting
- Why: The specific data signal driving the decision
- Expected Outcome: A measurable projection tied to pipeline or revenue
Example:
Action: Increasing investment in mid-funnel content for the manufacturing vertical.
Why: Manufacturing accounts converted at 2.4x the rate of other verticals last quarter but represented only 12% of our content distribution budget.
Expected Outcome: Projected to increase marketing-sourced pipeline in this segment by 25–30% over the next two quarters.
Implementation
Write the "What We're Doing Next" section before you finalize the rest of the report. Starting with forward decisions forces you to actually use the data rather than just present it. If you can't write a coherent forward section, that's a signal your data isn't generating the insights you need — which is its own useful finding.
⚡ Quick Implementation Tip
Before your next report goes out, add three lines at the bottom: Action, Why, Expected Outcome. Fill in one of each. That's the entire forward section on day one. You don't need three — one well-written forward item shifts the dynamic of the meeting more than any amount of additional historical data.
Business Impact
Gartner research shows that top-performing marketing organizations are more than twice as likely as underperformers to use data to optimize future strategies rather than just justify past spend. Adding a forward section isn't just a reporting change — it changes what marketing is in the executive meeting. The conversation shifts from "prove your worth" to "here's what we should do next." That's the conversation where marketing earns strategic influence.
The Bigger Picture: Reporting Is a Strategic Skill
These four quick wins aren't about metrics. They're about positioning.
Every report you produce is either making the case for marketing as a strategic function — or reinforcing the perception of marketing as an overhead cost. The difference isn't the data you have; it's how you structure the conversation around it.
Marketing teams that consistently translate metrics into business language, signal status clearly, and lead with forward recommendations don't spend meetings defending themselves. They spend meetings shaping strategy.
Start with one of these wins this week. Add the others over the next month. Within a quarter, your leadership conversations will look fundamentally different.
📊 Want the Complete Framework?
The Marketing Measurement Toolkit includes ready-built templates for everything in this article — executive scorecard, metric selection worksheets, traffic-light threshold guide, revenue attribution template, reporting cadence calendar, and campaign baseline framework. Sign up below for instant access.
|
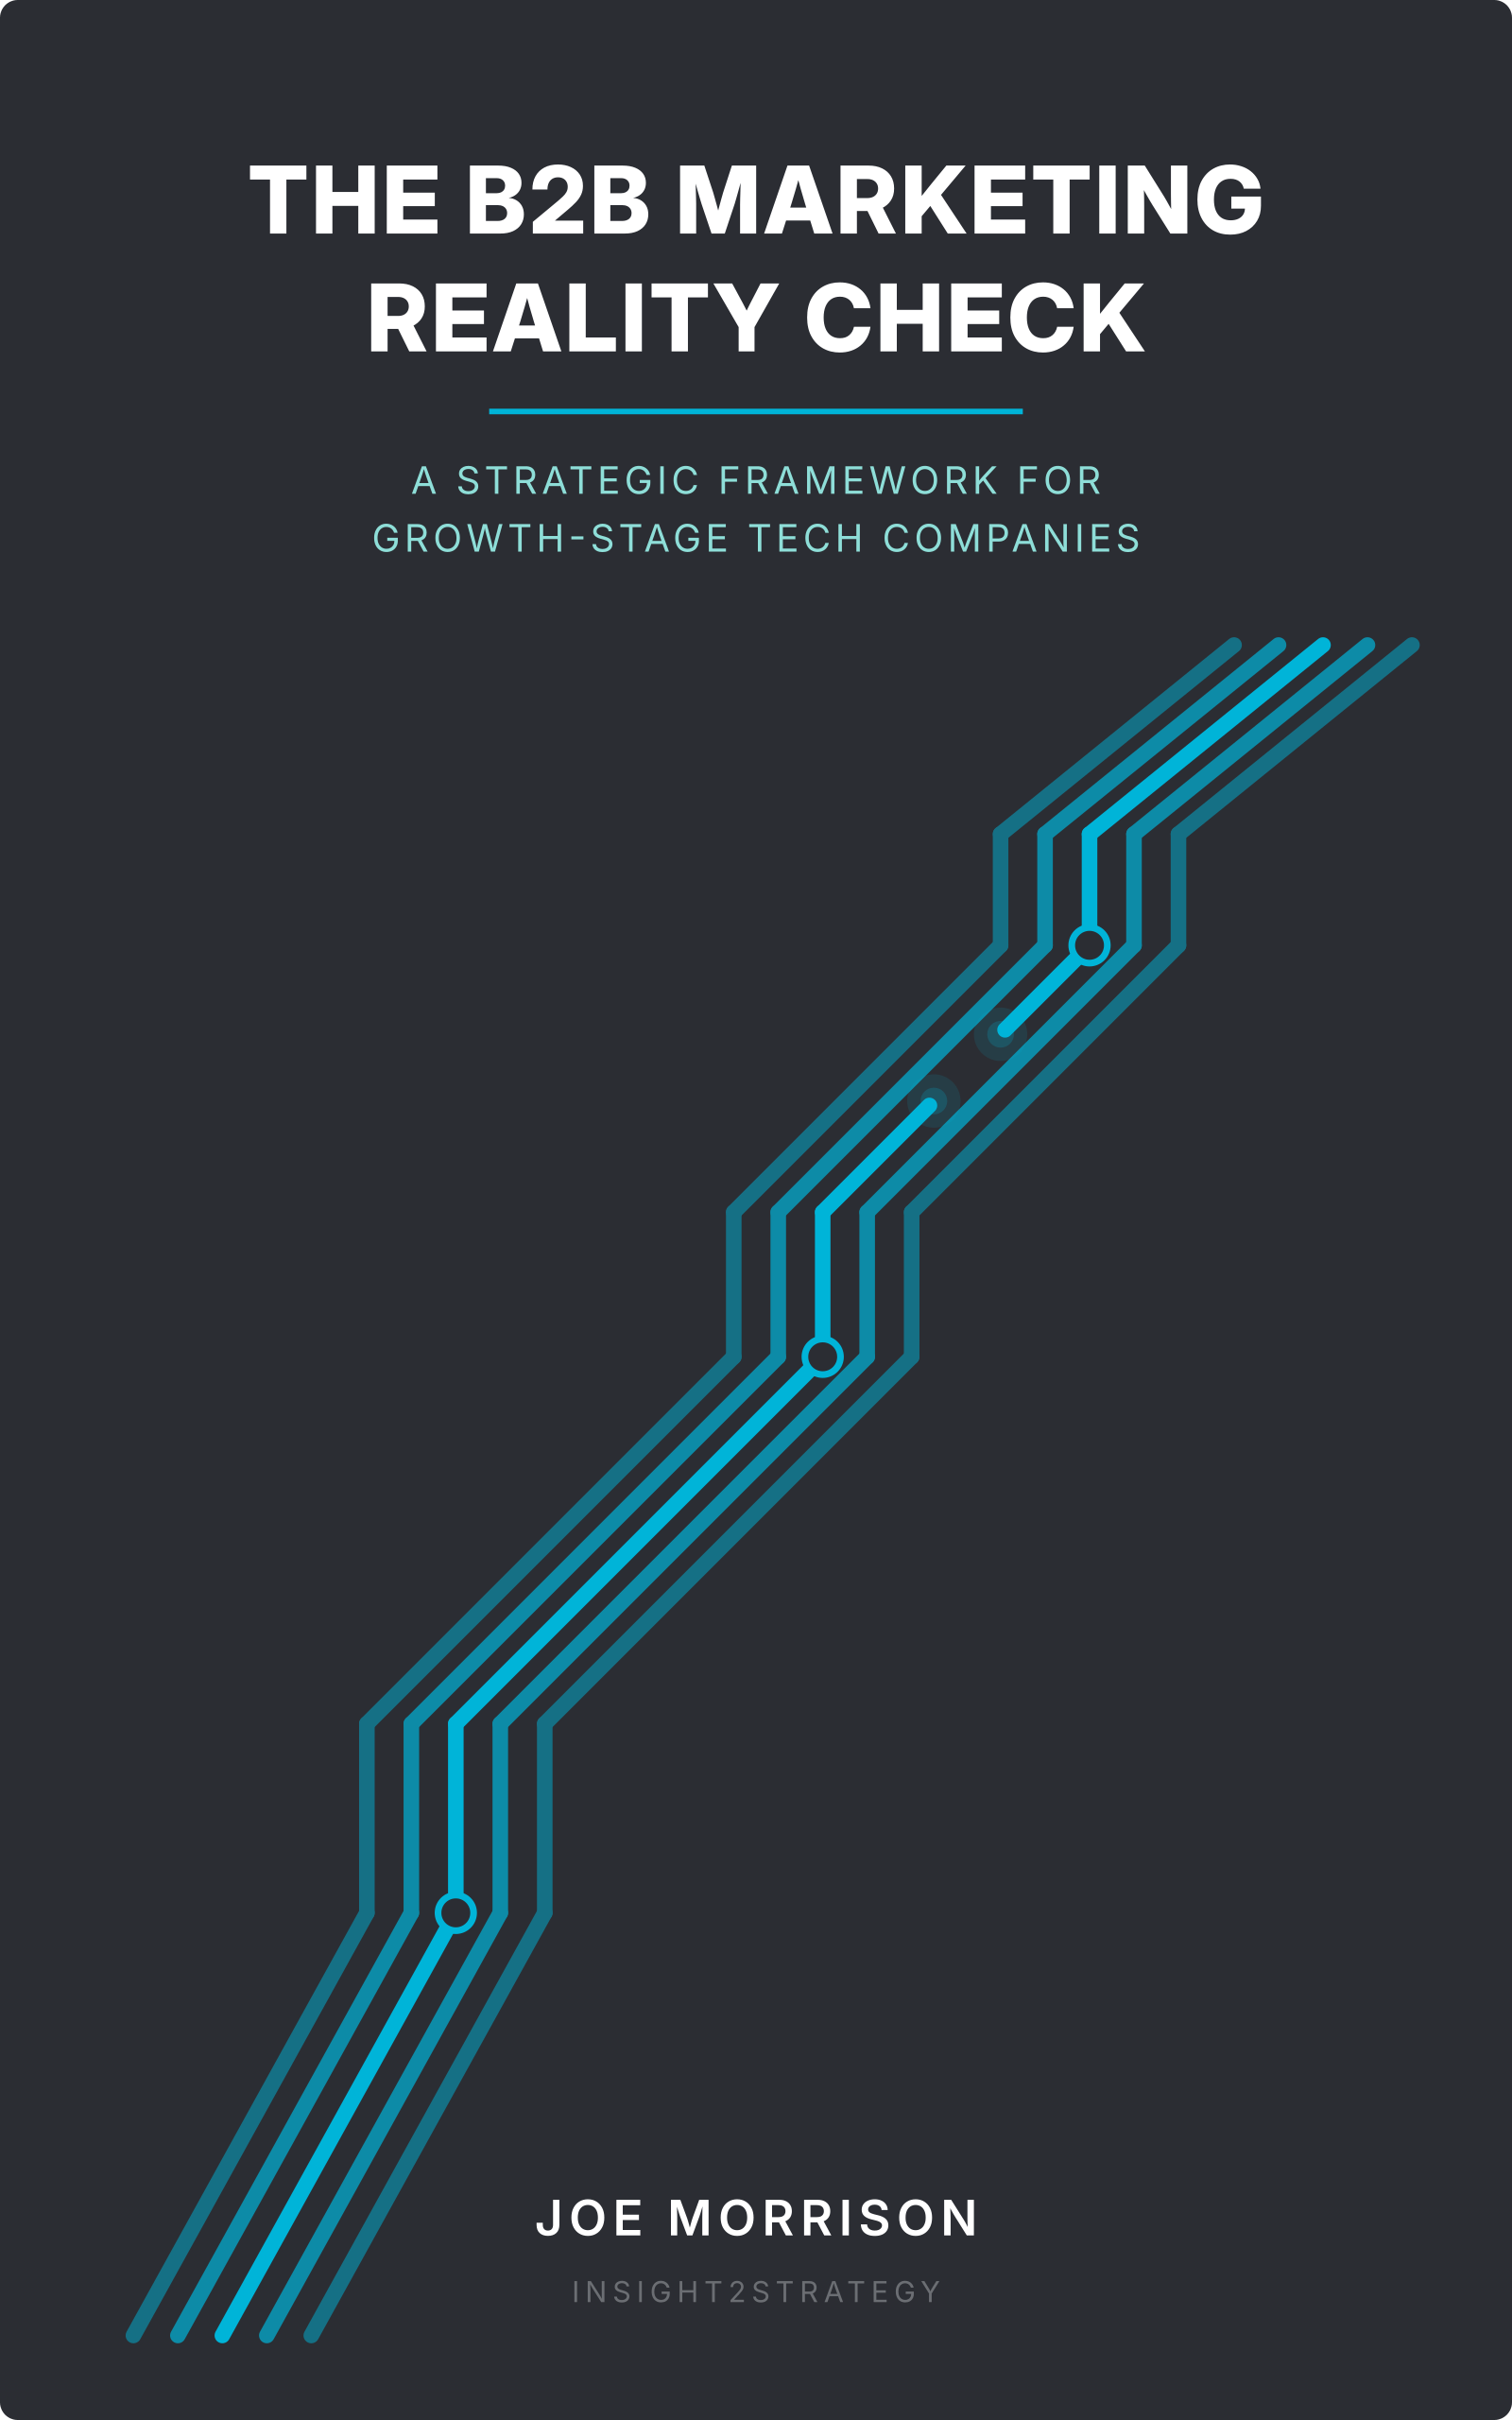
This post is part of The B2B Marketing Reality Check The strategic framework for growth-stage B2B tech companies — now available in paperback and Kindle. Every topic we cover in this blog goes deeper in the book, with frameworks, diagnostics, and quick wins you can put to work immediately. Get the Free PDF →Want to work through the framework hands-on? Get the companion workbook → |
Frequently Asked Questions
What should be on a 1-page marketing scorecard?
A 1-page executive marketing scorecard should include three sections: Pipeline Contribution (marketing-sourced pipeline, marketing-influenced pipeline, deals closed with marketing touch), Campaign Efficiency (cost per qualified opportunity, MQL→SQL conversion rate, pipeline per dollar spent), and Trend Indicators (pipeline trend vs. prior period, CAC trend, one forward-looking signal). Limit to 6–8 headline metrics total. If a metric doesn't fit on one page, it belongs in an appendix.
How do you set traffic light thresholds for marketing metrics?
Schedule a 30-minute meeting with your leadership team — one time — and agree on thresholds for your top 5–7 metrics. A practical starting framework: Green = within 5% of target; Yellow = 6–20% below target or two consecutive declining periods; Red = 20%+ below target or three consecutive misses. Document the agreed thresholds in a one-page "Reporting Standards" reference and apply them consistently every period.
How do you make marketing reports more forward-looking?
Add a "What We're Doing Next — and Why" section at the end of every report, structured around three elements: Action (what you're starting, stopping, or shifting), Why (the specific data signal driving the decision), and Expected Outcome (a measurable projection tied to pipeline or revenue). Write this section first — before finalizing the rest of the report. If you can't write a clear forward section, that signals your data isn't yet driving decisions.
How do you show marketing ROI to executives?
The most effective approach combines three elements: (1) Use a 1-page scorecard that leads with pipeline contribution — marketing-sourced revenue and deal attribution — rather than activity metrics like clicks and impressions. (2) Add a "What This Means" sentence to every metric that explicitly connects the number to a business outcome. (3) Build a revenue attribution model that documents the full chain from marketing touch to closed revenue for your top three channels, so you can state pipeline per dollar invested with confidence.
How long does it take to implement these marketing reporting changes?
Each of these four quick wins can be started within a week using tools you already have. The scorecard structure can be built in Google Slides, Looker Studio, or a spreadsheet in 2–3 hours. The "What This Means" translation template takes 30 minutes to create and 5–10 minutes to update monthly. Traffic-light thresholds require one 30-minute meeting with leadership. The "What We're Doing Next" section takes 15–20 minutes to write per reporting period once you have the habit.
Get the Free Marketing Measurement Toolkit
Six ready-to-use templates that operationalize every quick win in this article — so your next leadership report is built differently, not just written differently.
What's included:
- 1-Page Executive Scorecard template (pre-built, ready to customize)
- Metric Selection Worksheets — Layer 1, 2, and 3 classification
- Traffic-Light Threshold Guide with industry benchmarks
- 3-Metric Revenue Attribution Template
- Reporting Cadence Calendar (monthly + quarterly)
- Campaign Measurement Baseline Framework
Free download. Immediate access via email.
Download the Marketing Measurement Toolkit
Get instant access to the Marketing Measurement Toolkit — enter your email below and we'll send the download link right over.
Want to discuss how these reporting strategies apply to your specific situation?
Schedule a Strategy Discussion →When the Problem Isn't Reporting — It's the Market
These four quick wins assume your marketing is generating real signals to report on. But some teams find that even after improving reporting structure, leadership still asks: "But why aren't we converting?"
If that's your situation, the reporting may not be the issue. You might be operating in a market that isn't yet ready to convert — and no amount of reporting clarity changes external market conditions.
Our Market Readiness Score benchmarks whether your market environment is ready to respond to your marketing activity, giving you external context for your internal metrics.
👉 Get Your Market Readiness Score
If the underlying issue is spend efficiency — you're investing $3K+/month and can't trace it to pipeline — the Marketing ROI Diagnostic ($897) produces exactly the kind of dollar-value report this article teaches you to build. You'll leave with a clear attribution model, not just a framework for building one.
Conclusion
Better marketing reporting doesn't require new software, bigger budgets, or more time.
It requires four structural changes you can implement this week:
- Replace multi-page dashboards with a 1-page executive scorecard
- Add a "What This Means" sentence to every metric you report
- Build a traffic-light status system with pre-defined thresholds
- End every report with "What We're Doing Next — and Why"
Together, these changes shift marketing reporting from a defensive exercise into a strategic briefing. And that shift — from explaining the past to guiding the future — is how marketing earns a permanent seat at the leadership table.
About Insight2Strategy
Insight2Strategy helps B2B marketing leaders translate data into strategic influence — through frameworks, diagnostics, and consulting that connect marketing activity to executive-level business outcomes.
Visit Insight2Strategy →Marketing that earns a seat at the table.


Comments
Post a Comment